Part of our continuous effort to support growth while maintaining performance, reliability, and predictability is defining SLO’s (Service Level Objectives).
Part of our continuous effort to support growth while maintaining performance, reliability, and predictability is defining SLO’s (Service Level Objectives). Those are meant to define the expected service between the provider and the customer. They are specific measurable characteristics such as uptime, operations, and speed. For the cloud-based access control solution SALTO KS we will explain which SLO’s we measure and why.
Uptime
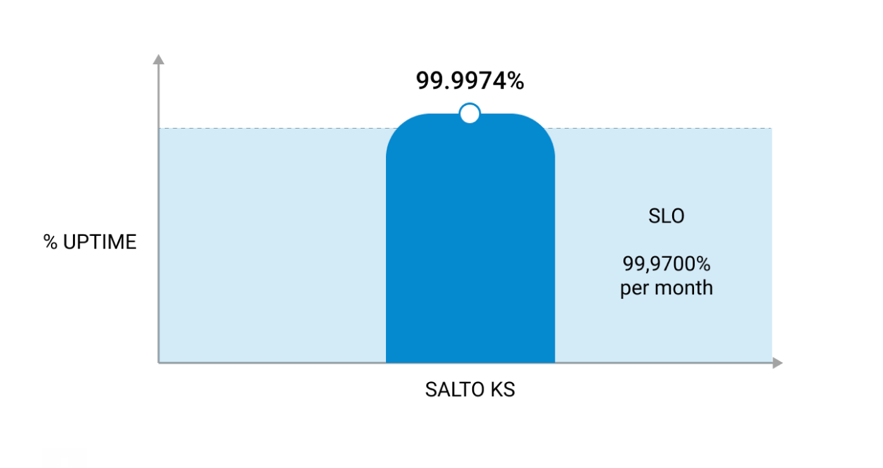
Up to now, our major focal point for measuring our overall Service Level Objective has been to look at the uptime of each individual service in our ecosystem and make sure those are at least adhering to our percentage of 99.9700%. The fact that we are meeting and exceeding that percentage for quite some time now is a great achievement of which we are very proud!
So?
Well, the high uptime percentage doesn't say that much about the customer experience. With a high percentage of platform availability, SALTO KS customers will be able to reach the platform and services, and the platform will do what it is supposed to do, but it does not say anything about the performance of individual functions a typical customer uses. We decided it was time we started looking at other things to measure.
What is important to the customers?
The operations of access control are of utmost importance for our customers. Fluctuations in individual response times of endpoints (i.e. the communication points that external software programs must send a request to in order to communicate with our API) that are used to control access rules like assigning a tag (physical credential), adding or removing a user from an access group, blocking a user, and configuring offline access for a lock have a big impact on the day-to-day experience of a client may have while performing their daily tasks.
Another important factor is the overall performance of operations that require a direct response from an IQ (Edge device), like activating an IQ in a mobile app, performing a remote opening, or generating a Digital Key. If it takes too long, users might consider it not working or at least bothersome. When changes have been made to access rules, we want to make sure that they are applied to the IQs involved as fast as possible, because only then they will have an actual effect.
Reporting
Last but not least, we want customers to be able to retrieve event information in a performant way. We have two different types of events: entries (basically openings and rejections from locks, so large volume) and incidents (alerts like doors being left open and lock tampering, so low volume).
We know that other things happen that could make or break customer satisfaction, like installing or restoring IQs, attaching locks, and receiving notifications and we do measure them, but the four categories mentioned above are what we consider most important for the largest number of users.
What do we want to achieve and measure?
For these four types of interactions with our platform, we needed to come up with response times or maximum duration times that would be considered “good” and “natural” from a user perspective, and we should then compare those to what we are actually delivering.
As a general point, we decided that we should be able to achieve our “good” performance goals at least 75% of the time. This would obviously mean we could score less during some peak hours, but overall the customer experience would be good. We decided to measure against that over a period of 7 days to be able to clearly see fluctuations during the week.
We set the following SLO’s for each of the four types:
- Access Control operations: response time should be less than or equal to 0,5 seconds.
- Synchronous IQ operations: response time should be less than or equal to 2,5 seconds.
- Sync performance: the duration should be less than or equal to 30 seconds for Local Access Management sync, PIN sync, and Accessor/Key sync combined, and less than or equal to 5 seconds for Offline Access Key sync.
Reporting: response time should be less than or equal to 3 seconds for entry reporting and less than or equal to 1 second for incident reporting.
These SLO’s aren’t just there to give a nice overview, they’re used in day-to-day monitoring of system performance. The team is on-call 24/7 to ensure the right user experience. The SLO’s, metrics and goals are reviewed by the teams recurrently to guarantee we live up to all expectations. The dashboards are shown in the Clay office where SALTO KS is built and can be viewed “live” from any location, to guarantee each of the team members are well aware of the performance of the platform and show the direct impact of their work.
So where do we go from here?
In the past, we have been working on defining ways to improve mainly our LAM (Local Access Management) sync process so we are able to set achievable goals per sync type and also per tenant in the future, whilst still being able to cope with our projected growth. We see that sync performance is heavily affected between tenants and although our performance is good most of the time, sometimes it can be a challenge. At least now we feel we can immediately see any effect on performance that has an impact on our user experience and shift our focus accordingly if needed. During the design of any new component, we now keep in mind the ability to measure its performance from the start so we won’t need to struggle afterwards.
We have also defined some SLO notifications in Datadog, all based on the numbers above (and some more detailed ones). Whenever we see an increase in failure to achieve our intended performance, our ‘Core team’ is notified so we can investigate. From what we see now these are temporary states that recover within 5 to 10 minutes and are caused by the incidental increased load. We will be turning these in the coming weeks so they are not generating false alerts before we will increase the audience for them. For the operations mentioned above, all our SLOs are performing around or above 90%, exceeding our 75% target by quite a lot.
Find us on Instagram and LinkedIn to start the conversation. Want to stay informed about everything access control? Click here to discover more about SALTO’s solutions.
